
Prologue
I carried out my tertiary education, postdoctoral research, and work life during the remarkable period described below. It is the milieu over which I performed the research program described here. Using this example (1989 to 1999) I’ll illustrate how Research Management has come to set agendas for research by becoming arbiters of the productivity of researchers. I intend this article as a warning and a call for researchers to reclaim research by rediscovering “when research was research.”
Used to be — “back in the day” — ca. 1976 when I studied chemistry at the University of NSW, there was a Faculty of Applied Science and a Faculty of Science, occupying some of the most impressive buildings. There was a Faculty of Commerce but no Faculty of Business [1]. The word entrepreneur was hardly ever heard and the richest business people were known as tycoons. The aging J. Paul Getty, an oil baron, was the richest man in the world in the mid-1970s. In Australia, some of the richest men were media and press moguls Kerry Packer and Rupert Murdoch. Another notable wealthy-figure was the iron-ore mining magnate Lang Hancock (the father of Gina Rinehart). None of this would have much interested me. It was research that was my interest. As I will show in this article.
The decades that followed seen the rise and rise of the business entrepreneur leading to multi-billionaires such as Sir Richard Branson, Geoff Bezos and Elon Musk, all household names. Many others could easily be added to this list. The difference between an old-time tycoon and an entrepreneur is that entrepreneur’s risk their own funds to create new products or services and break open markets that didn’t exist previously. Typically, these products and services are technological. The role of the entrepreneur, according to an orthodox view, is such an essential part of our economy that we afford entrepreneurs special social standing and call them “thought leaders.” To supply entrepreneurs to the world economy, undergraduate and postgraduate Business Faculties and Schools have proliferated at our universities. The rigmarole of business management, branding, mission and vision statements, milestones, Gantt charts, checklists, end-user surveys, performance objectives and so much else have invaded every nook and cranny of our modern working lives.
Introduction
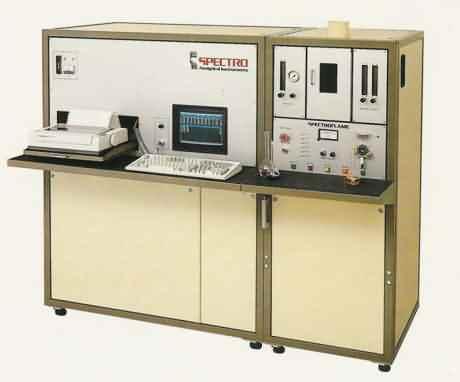
My primary research direction was Analytical Chemistry for inorganic elements, using optical emission spectrometry or mass spectrometry. When I returned from postdoctoral research at Indiana University, I worked as a research scientist for what was then Varian Techtron (now Agilent Technologies) at their Springvale, Melbourne factory. Amongst other things, I worked on the Liberty 100/200 ICP-OES unit (no longer in production). I’d like to thank my supervisor, Barry Sturman for suggesting one aspect of my work with the Liberty. This was to develop an integrated module for digitally enhancing spectra using the in-built computer system. The Liberty used a holographic 1800 lines/mm grating in a 0.75 m Czerny-Turner configuration monochromator [2]. This level of optical performance was commonplace within the industry ca. 1991 but is insufficient for many analytical purposes, such as simultaneously determining traces of Cd and As in the presence of each other, such as in cigarette smoke, ash, or tobacco. II’ll present a workable solution for this problem in Part 2 of this article with the SPECTRO Spectroflame instrument of comparable optical performance (using a 0.75 m Paschen-Runge mounted fibre-optic based monochromator with a 1800 lines/mm grating) [3]–[4].
In 1988, before the dividing-wall can down, a soon-to-be colleague travelled to West Berlin through the train corridor in communist East Germany, from free West Germany, [5]] to purchase a SPECTRO Spectroflame instrument for the Queensland University of Technology (QUT).
Collecting Data
When I arrived at QUT, the Spectro instrument was in a wooden box because the Chemistry building was being renovated. After some months, with the building still closed for renovation, my colleague, whom I mentioned above, had successfully applied to get the ICP-OES instrument up and running because renovations were no longer being carried out on level 3 (of 5 levels). Although he had permission to be in the building on level 3, I didn’t. I carried out most of the solution and data collection during that week between about 6 pm and 5 am during this closed for renovation period. When security came around in the middle of the night, I turned off the light and sat behind the instrument until they left. Given that I was still on a probationary period in a new job, I was fortunate not to be discovered. I left around 4:30 am and was home around 5 am, kissed my wife, grabbed a couple of hours’ sleep and went back to work again. I had a light teaching load that first semester, but I still was managing a growing list of other research projects and students, writing grants; all the things that make up the life of a busy academic. It took me 3-days one week and about 2-days in another week to collect all the data.
Those who knew me later might not recognise me as the person described above. I’m not sure I do. I was much younger and could be brash and impulsive because:
if I could crack the problem of digitally restoring spectral detail beyond the optical band limits for ICP-OES, then it could it could apply to all kinds of other spectrometry as well. This was a big deal.
I left Varian with a floppy disk containing some rough data, and a rough algorithm coded in Fortran. I didn’t worry about continuing on the same research work from Varian to QUT because I had secured one of the first Australian Postgraduate Research Awards with Industry for a similar project to build an interferometric spectrometer [6]. For this reason, cordial and collaborative relations between my research group, Varian and QUT, existed. That data was rough because I had a wavelength scan of spectral lines from a hollow cathode lamp (HCL). But crucially, I had forgotten that HCLs were modulated at 300 Hz. Later, I tried to remove the 300 Hz signal using a Blackman digital filter. The result was usable but compromised by the digital modification (when I repeated this experiment at QUT; I removed the 300 Hz modulation with a large-capacitor across the output terminals of the HCL power unit).
Computer Systems
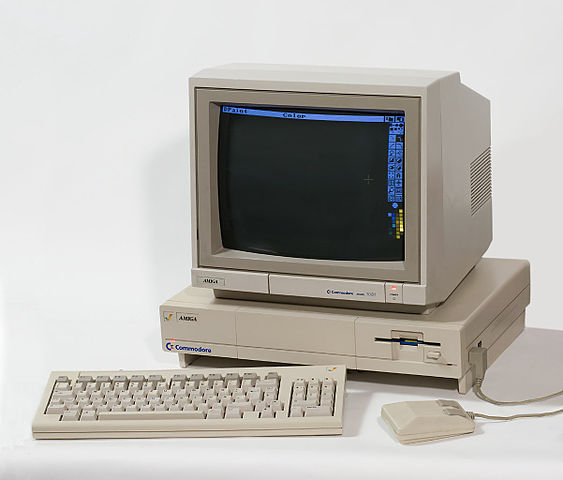
At my cost, I had purchased a third-party enhancement kit to speed up my personal Amiga 1000 computer using a MC 68881 floating point chip together with a MC 68020 processor and extended memory. This cost a small fortune but offered a 3-4 fold increase in performance for floating point operations. I was very fortunate to find a 2nd-hand copy of Absoft Fortran for Amiga (which supported the 68881 FPA chip) at a weekend Amiga User’s group meeting. This was enough to get me started, but progress was slow because even with FPA acceleration, my rough program proceeded at about 1 iteration per 4 hours. Not very effective for debugging when several iterations were required to see if the numerical algorithms were working correctly.
During that first semester at QUT I did several things which, even looking back, I still consider being clever. First, I realised that my rough algorithm I’d brought from Varian was n2 in degrees of freedom. This meant that doubling the data points across the wavelength scan, e.g., from n= 100 to 200 points required 4-times as much computing power (rather than 2 times). The 100 x 100 square matrix I was using for the point-spread-function was a Toeplitz matrix that contained repeating elements that could be stored more compactly as a single 1 x 100 vector which reduced the problem from n2 degrees-of-freedom per iteration to 2n-1, directly leading to a massive speed-up in computation. I implemented this in my algorithm written in Fortran code. Today, this would have been a simple matter of finding the term “Toeplitz” in a Wikipedia search. This was definitely not the case in ca. 1990.
Another aspect of this work during that first semester was the realisation that the algorithm I’d developed with maximum entropy was the same as an application of Bayesian statistics, with maximum entropy as a likelihood function. Perhaps the greatest achievement during this time was the realisation that my maximum entropy algorithm could be straight-forwardly modified to include cross-entropy (Kullback entropy). This held out the prospect of including hundreds of years of prior information gathered in atomic spectrometric wavelength tables [7], including line positions, line widths and lines shapes.
If the maximum entropy algorithm was a big deal, then a cross-entropy algorithm was a big deal with whipped cream and a cherry on top.
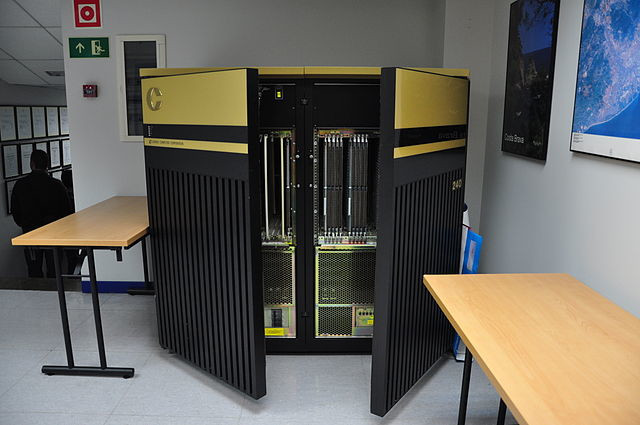
During the early 1990s, QUT purchased a supercomputer from Convex Computer Systems (Richardson, TX). The Convex C3 supercomputer was ideal for this project. Whereas my enhanced Amiga 1000 took 4 hours per iteration, The Convex machine could complete an iteration, using my improved Fortran code, in a few seconds. This was a speed-up of around 4000-fold owing to improvements in the algorithm, it’s coding and because of the superiority of the Convex machine in performing vector-based operations [8]. All the results presented here were obtained using the Convex supercomputer.
I used my Amiga to connect with the supercomputer over a 300 baud modem. As before, I worked on this project in the evenings and on weekends. I was very much aware of how incongruous it was to use a 300 baud modem with a supercomputer. Later on I used a 2400 bps modem with a laptop PC.
Setbacks
The data (including backups) I had collected from the Spectro ICP-OES was on a box of 10 x 3.5 in floppy disks. From the Spectro operating software, I couldn’t find an option for storing spectral scan data as a text file or using an interchangeable data format, such as csv. Because of this, the only way to read the spectral scan data was to write a program to read binary data directly. A phone call to Spectro technical support revealed that the Spectro ICP-OES software was written in Microsoft QuickBasic. I used whatever version of QuickBasic that came with my laptop PC to write a program to read the raw binary data and rewrite it as a column of decimal numbers in ASCII text. It seemed simple and the data I converted looked exactly the same as the data on the screen of the instrument itself.
After spending months working with this data and not making progress, I knew there was a serious and hard to debug problem confronting me. Things are never as simple as they seem. I assumed the data written to disk by the Spectro instrument was in standard IEEE-754 real number format [9]. Little did I realise Microsoft used its own proprietary format for real numbers in QuickBasic version 4.0 and earlier [10]. At some length, I resolved this problem so that the project could continue. I hope to present some corrected results in a subsequent article. But this incident took much of the wind out of my sails, set the project back by almost a year, and used up over a 100 hours in wasted supercomputer time. Fortunately, I didn’t pay for the supercomputer use.
Unbeknown to me, I was approaching a point where, despite my best efforts, the project would succeed or fail depending upon whether I could access to increased manpower and skills from postgraduate students and other collaborators. I approached a colleague from the School of Mathematics with whom I wrote an Australian Research Council Grant (ARC-large) application, which was unsuccessful. The collaboration didn’t continue afterwards. Such a heavy mathematical and computational project was a hard sell to prospective honours and postgraduate students in chemistry.
Results
Method Validation
A positive aspect of my setbacks was that it forced me to develop realistic simulations using synthetic test data. Fig. 4 shows the synthetic test spectrum as the orange-coloured series. Convolving this test spectrum with a Gaussian function, approximating the optical broadening of a typical ICP-OES instrument, is shown as the blues-coloured series in Fig. 4. The synthetic spectrum is an exacting test of the algorithm developed because of the sharpness of the spectral peaks and the close-spacing of the peaks themselves. Note: the figures use responsive-web-based graphics, clicking on the series in the legend will highlight it.
[wpdatachart id=25]
Fig. 4 Shows the test spectrum as both the broadened (blue) and unbroadened l (orange) series.. After 6000-iterations the restored spectrum is in satisfactory agreement (red) to the unbroadened test data.
The red-coloured series in Fig. 4 is the restored spectrum after 6000- iterations. As you can see, the restoration is favourably close to the original synthetic test spectrum, but falls short of restoring the true sharpness of the synthetic peaks. However, the line positions, ratio of peak heights and the lines-shapes have been mostly reestablished. This satisfactory recovery of the synthetic test spectrum gives assurance that the algorithm has been validated.
Moving Goal Posts
One reason this project came to an unsatisfactory end was that, despite my setbacks, I needed to speed up, not slow down. It was the dawn of the internet age. Zuckerberg, the CEO of Facebook, had said: “Move fast and break things” [15]. As mentioned, there was a juncture at which I needed to attract fresh skills and manpower. In cutting-edge research, others can beat you to important discoveries unless you move fast. In my case, ICP-OES as an analytical technique was being superseded by ICP-MS. If only I could find a way of applying my computer-based methods to ICP-MS? For ICP-MS, I couldn’t see a way forward in ca. 1994. I realised that my algorithms and methods could apply to other forms of optical and Xray spectrometry, but there were researchers already working on maximum entropy, or similar methods in those areas [16]–[18].
As suggested in the partial title “when business was commerce” there were other reasons my research on digitally enhanced spectroscopy ended. In particular, how work productivity changed starting in the mid-1990s. Looking back suddenly, work productivity became personal. This resulted from the convergence of the digital and internet worlds into a new age of rapid communications and technological change. The rules that applied to a products and services economy no longer applied. Knowledge workers were needed for business productivity in the new economy. But to be productive, knowledge workers needed latitude in determining their own schedules and arrangements for work. It was no longer possible for a group of business executives to determine how work should be performed and then replicate those rules across their businesses. Work productivity came to have personal.accountability. Instead, business executives became the arbiters for measuring productivity through the individual and collective actions of their workers.
Researchers were always in the vanguard of the knowledge economy. What was different was how their productivity would be measured. It had always been as a member of as a Chemistry Department previously. Now accountability was becoming more and more personal. For me, the smallest unit of research was the research group of students and junior colleagues that carried out the research. I witnessed so many of my colleagues progress in their careers, claiming to be the research leader and therefore responsible for managing the research outputs of their students and more junior colleagues.
For close to 2 centuries, the primary measure of research productivity has always been the published research paper. The moving goal posts here was that publishing papers in top-ranking journals became high-stakes and the aphorism “publish or perish” became a justification for the reallocation of academics from teaching and research roles to teaching only positions; for promotion committees to deny advancement to the professoriate and, in some cases, research academics were terminated.
Their impact factor (IP) defines top-ranking journals, IP shows how frequently articles in a specific journal are cited in research the journal publishes. Rates of citation of their research papers also ranked researchers. The h index is a metric based upon a researchers’ cumulative contributions to their field [19]. On one occasion, I overheard postgraduate students comparing h indices for their supervisors.:they had constructed league tables of researchers based on their h indices. At least the impact factor and the h index are well-defined and limitations in their application are well-publicised in the literature.
A worrying aspect of metrics is that different universities apply them in different ways. At least one university in Australia has applied the h index only for publications in the last 5-years. Some universities, or departments within the university, apply additional ad hoc measures. One such ad hoc measure is that productive researcher needs to gain more than their salaries in research grants. Sometimes, this translates to n x their salaries where n = 2 or 3. These productivity measures were applied with little warning and without the usually accepted period to bed them down and ensure they were working fairly and with general agreement of staff and staff representative bodies.
These individual productivity measures created a great deal of anxiety for staff that were already under considerable stress. There was a marked increase in mental health issues for research staff. For me, it was the final straw. I started having persistent negative thoughts about whether I was doing something wrong in carrying out unfunded research. What if my supervisor found out I was spending too much time doing work, not funded? I started thinking, irrationally, about Varian / Agilent coming to take the research away from me. Far from trying to publish research, I worried about whether I should try to hide it. Yes, I’m okay and have been OK for quite a while. Writing this article is, for me, a final cleansing from the residues of such negativity. However, mental health care for researchers continues as a pressing concern.
Conclusions
In this article, I’ve tried to argue that the value of research is research. Research should never be allowed to become an Orwellian doublethink for something it’s not. For this reason, business managers from Universities, governments and industry shouldn’t be the sole arbiters of research value and researchers productivity.
Research has its own definitions of success that centuries of successful discovery have honed. External management definitions of research quality are secondary indicators that should only apply to aggregate research; business management indicators shouldn’t apply to individuals or to specific research groups. In a similar vein, other external factors, such as citation statistics, including the h index, are useful performance measures but they aren’t complete.
Certainly, research metrics favour established fields of study. Highly original research doesn’t gain the recognition it should. Indeed, if an established researcher changed direction to a ground-breaking research in a new field, then their h index would suffer, at least for several years. I’ve tried to illustrate this, from my research. Digital restoration of spectra beyond the optical bandwidth is no longer seminal or ground-breaking but it was during those early years described above.
Researchers let’s reclaim our research by reframing metrics for productivity, setting an agenda for identifying and recognising seminal research, valuing research for its own sake and budgeting for research accordingly.
If research is research, and not just another form of business transaction, then what measures should be applied to judge quality research and researchers? *Please answer in the comments.
Epilogue
I feel extraordinarily privileged to have had a career in research. I still count myself as an active researcher. The business I registered is called “Mark Selby Research and Consulting.” If this article has sparked your interest in digital spectral enhancement, then please contact me. This is Part 1 of a multi-part article. This article is complete but Part 2, as currently drafted, will contain further insights and practical results for the Fortran program known as Maxent as described here.
Who knows, I may have missed the big deal but maybe there is still some whipped cream and cherry left?

Written with StackEdit.
References
[1] UNSW Sydney, “UNSW – Handbook (Archive Edition),” Printed Publication (1957-2006), 1976. https://legacy.handbook.unsw.edu.au/assets/home.html (accessed Dec. 27, 2022).
[2] “Liberty 100 ICP-OES Spectrometer ( Varian Inc. (Part A) ) | EVISA’s Instruments Database.” https://speciation.net/Database/Instruments/Varian-Inc-Part-A/Liberty-100-ICPOES-Spectrometer-;i2936 (accessed Jan. 12, 2023).
[3] J. A. C. Broekaert, “Emission spectrometric instrumentation,” Spectrochim. Acta Part B At. Spectrosc., vol. 43, no. 2, pp. 203–211, Jan. 1988, doi: 10.1016/0584-8547(88)80008-9.
[4] “Spectroflame – Sequential ICP-OES Spectrometer ( SPECTRO Analytical Instruments Inc. ) | EVISA’s Instruments Database.” https://speciation.net/Database/Instruments/SPECTRO-Analytical-Instruments-Inc/Spectroflame–Sequential-ICPOES-Spectrometer-;i2966 (accessed Jan. 14, 2023).
[5] S. Jordan, “The Berliner Military Train,” GaugeMaster, 2020. https://www.gaugemasterretail.com/magento/rightlines-article/the-berliner-train.html (accessed Jan. 01, 2023).
[6] R. J. Hughes, “The application of array detector technology to interferometric spectroscopy : design, analysis and development,” PhD Thesis, Queensland University of Technology, 1994. Accessed: Jan. 15, 2023. [Online]. Available: https://eprints.qut.edu.au/37146/
[7] G. R. Harrison, MIT Wavelength Tables, Vol. , Second edition. Cambridge, Mass: The MIT Press, 1969.
[8] G. Astfalk, “Parallel programming on the Convex MPP,” in Proceedings of OCEANS’94, Sep. 1994, vol. 1, p. I/573-I/578 vol.1. doi: 10.1109/OCEANS.1994.363934.
[9] D. Hough, “Applications of the Proposed IEEE 754 Standard for Floating-Point Arithetic,” Computer, vol. 14, no. 03, pp. 70–74, Mar. 1981, doi: 10.1109/C-M.1981.220381.
[10] “Microsoft Binary Format,” Wikipedia. Dec. 24, 2022. Accessed: Jan. 16, 2023. [Online]. Available: https://en.wikipedia.org/w/index.php?title=Microsoft_Binary_Format&oldid=1129349524
[11] S. M. Kang, W. Nazeer, M. Tanveer, Q. Mehmood, and K. Rehman, “Improvements in Newton-Rapshon method for nonlinear equations using modified Adomian decomposition method,” Int. J. Math. Anal., vol. 9, pp. 1919–1928, 2015, doi: 10.12988/ijma.2015.54124.
[12] K.-H. Pho, “Improvements of the Newton–Raphson method,” J. Comput. Appl. Math., vol. 408, p. 114106, Jul. 2022, doi: 10.1016/j.cam.2022.114106.
[13] L. Fang and L. Pang, “Improved Newton-Raphson Methods for Solving Nonlinear Equations,” J. Adv. Math., vol. 13, no. 5, Art. no. 5, Dec. 2017, doi: 10.24297/jam.v13i5.6533.
[14] E. H. Van Veen, M. P. Goudzwaard, M. T. C. De Loos-Vollebregt, and L. De Galan, “Fourier Deconvolution of Overlapping Line Pairs in Inductively Coupled Plasma-Atomic Emission Spectrometry,” Appl. Spectrosc., vol. 43, no. 1, pp. 96–103, Jan. 1989, doi: 10.1366/0003702894202049.
[15] J. Liles, “Did Mark Zuckerberg Say, ‘Move Fast And Break Things’?,” Snopes, Jul. 29, 2022. https://www.snopes.com/fact-check/move-fast-break-things-facebook-motto/ (accessed Jan. 17, 2023).
[16] B. Buttingsrud and B. K. Alsberg, “A new maximum entropy-based method for deconvolution of spectra with heteroscedastic noise,” J. Chemom., vol. 18, no. 12, pp. 537–547, 2004, doi: 10.1002/cem.898.
[17] S. Mähl et al., “Innovative Methods for a Deconvolution of XPS Spectra from Plasma-oxidized Polyethylene,” Surf. Interface Anal., vol. 24, no. 6, pp. 405–410, 1996, doi: 10.1002/(SICI)1096-9918(199606)24:6<405::AID-SIA136>3.0.CO;2-Z.
[18] B. Z. Belashev, “Methods for Reconstructing the Structure of an Indistinct Spectrum,” J. Appl. Spectrosc., vol. 68, no. 5, pp. 838–846, 2001, doi: 10.1023/A:1013250002033.
[19] J. E. Hirsch, “An index to quantify an individual’s scientific research output,” Proc. Natl. Acad. Sci., vol. 102, no. 46, pp. 16569–16572, Nov. 2005, doi: 10.1073/pnas.0507655102.
